Technology
PC-Based DRIMS
This version of DRIMS utilizes the vertical acceleration of an ordinary vehicle to estimate IRI (see Figure 1).
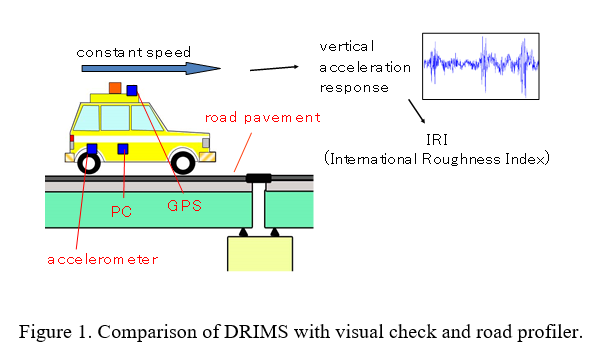
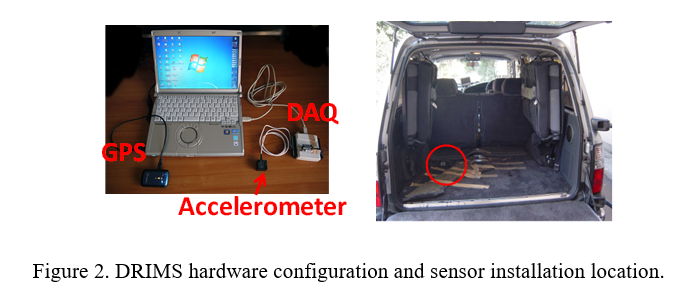
PC-based DRIMS measurement hardware consists of an accelerometer (Silicon Designs 2012-005), data acquisition module (DAQ; NI USB-6009), and GPS (Transystem 747pro) (see Figure 2). The DAQ connected to the accelerometer communicates with the PC through a USB-serial port. GPS is connected to the PC. The acceleration time history, which is recorded at 200 Hz, and the 1Hz GPS signals are saved as text files on the PC. The acceleration time history has 1 Hz GPS time stamp so that the vehicle responses are related to the GPS signals.
The accelerometer is mounted on the inner top surface of the vehicle body above the outer (i.e., left in Japan) rear wheel (see Figure 3). The outer track usually suffers from more damage. The DRIMS accelerometer located is determined to be near the outer track. The installation is only inside the vehicle body and requires no vehicle modification.
International Roughness Index and Its Estimation
International Roughness Index (IRI) has been proposed by World Bank as an indicator of drive comfort. IRI is defined as,
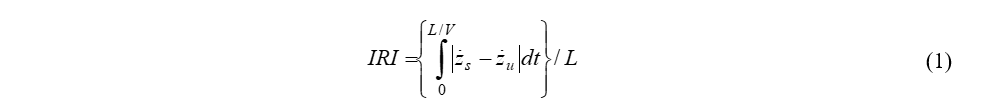
where zs is vertical absolute displacement of sprung mass of the standard quarter car (QC), zu is vertical absolute displacement of unsprung mass, L is the length of evaluation section, V is the driving speed (22.2 m/s = 80 km/h), and t is time.
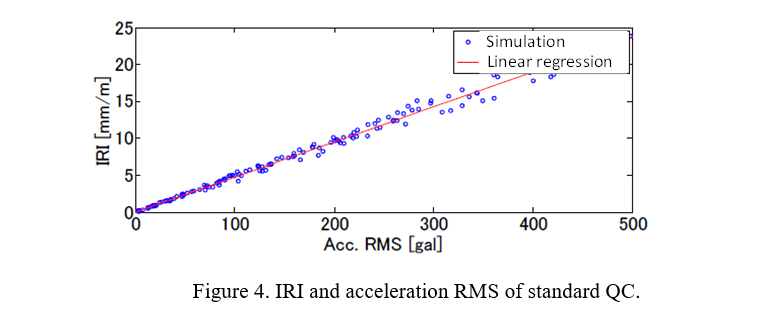
The IRI estimation process of PC-based DRIMS is summarized as in Figure 3. For each evaluation length of 200m, acceleration response zm(t) of the measurement vehicle is converted to the frequency domain as Zm(w) and acceleration RMS of the standard QC is estimated as follows:

where RMS is the vertical acceleration RMS of the sprung mass of the standard QC, (two dot) zs (t) is the vertical acceleration of the sprung mass of the standard QC, (two dot) Zs (ω) is the Fourier transform of (two dot) zs (t), (two dot) Zm (ω) is the Fourier transform of the vertical acceleration of the measurement vehicle. The acceleration RMS of the standard QC has a high correlation with the IRI as in Figure 4. Using the linear regression, IRI is estimated. The high correlation is partially explained by the fact that the transfer function from the road profile to the acceleration of unsprung mass is similar to that from the profile to the relative velocity.
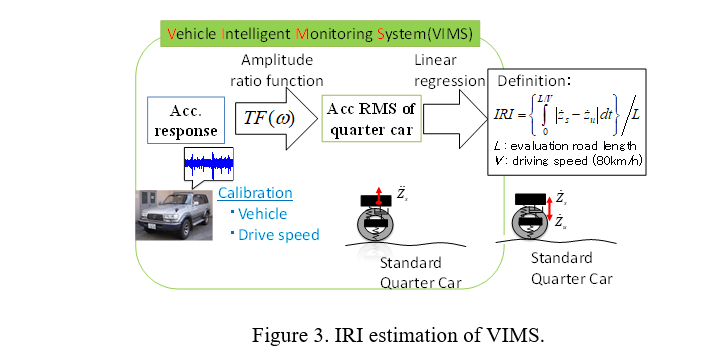
In this IRI estimation process, an accurate estimation of TF(ω) is important. The amplitude ratio function depends on the measurement vehicle and the driving speed. The amplitude ratio function TF(ω) is estimated as follows:

where PSDQC (ω) is the power spectral density function of the standard QC acceleration and PSDm,y (ω) is the power spectral density function of measurement vehicle at driving speed y.
Several ways to estimation the function, or to calibrate the vehicle and speed, have been studied depending on measurement conditions. One calibration technique is transfer function estimation by driving on a road with known profile. The transfer function at each drive speeds can be estimated experimentally. Shortcoming of this approach is that a test road with known profile is needed. Another calibration technique is identification of vehicle parameters by assuming a quarter model. The transfer function is then estimated by numerical simulation of the identified vehicle model. Quarter car models with nonlinear damping characteristics have been investigated to improve the accuracy. At the beginning of the DRIMS research, the first calibration technique was utilized because of its robustness. However, through implementation in Kenya and other countries, the need for simpler calibration became clear. The second approach has thus been utilized lately.